This graph shows the normal concentration of morphogens A and B throughout a Drosophila embryo. 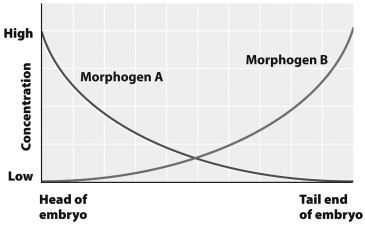
If morphogen B is injected into the head end of an embryo, the embryo is likely to develop
A) normally.
B) a second tail at the head end
C) a second head at the tail end.
D) two heads at the head end.
Correct Answer:
Verified
Q12: Sperm are packed with mitochondria because mitochondria
Q20: Which one of the following methods of
Q26: The human embryo develops in a fluid-filled
Q26: By the end of a normal first
Q33: Embryonic stem cells have the greatest potential
Q36: In humans,the exchanges of materials between the
Q39: During the rapid cell division that occurs
Q40: The body retains stems cells after embryonic
Q53: Different versions of the protein hemoglobin are
Q55: Which of the following does not affect
Unlock this Answer For Free Now!
View this answer and more for free by performing one of the following actions

Scan the QR code to install the App and get 2 free unlocks

Unlock quizzes for free by uploading documents