Examine the graph below. 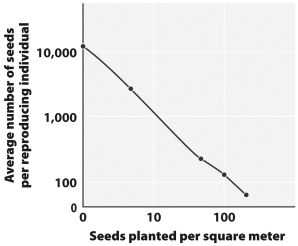
What statement best describes the relationship between planting density and seed production per individual plant?
A) At high planting densities, both seed production per plant and total seeds produced declines.
B) At high planting densities, seed production per plant declines while total seeds produced remains constant.
C) At low planting densities, both seed production per plant and total seeds produced increases.
D) At high planting densities, seed production per plant declines while total seeds produced increases.
Correct Answer:
Verified
Q13: The size of a population can be
Q18: A new species is introduced into a
Q19: Which of the following choices best explains
Q21: The initial success of a human civilization
A)
Q25: Which of the following statements about carrying
Q25: The figure below shows that the human
Q26: Which of the following populations would be
Q27: The current rate of human population growth
Q28: The top of the "S"in an S-shaped
Q28: What was the effect of the pesticide
Unlock this Answer For Free Now!
View this answer and more for free by performing one of the following actions

Scan the QR code to install the App and get 2 free unlocks

Unlock quizzes for free by uploading documents