Scores on a test have a mean of 72 and a standard deviation of 12. Random samples of size 64 are drawn from this population and the mean of each sample is determined. Use the Central Limit Theorem to find the mean
And standard error of the mean of the sampling distribution. Then sketch a graph of the sampling distribution.
A) 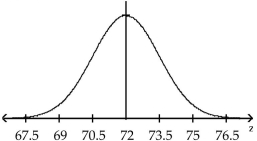
B) 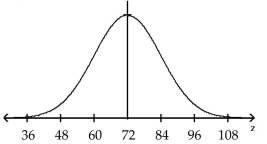
C) 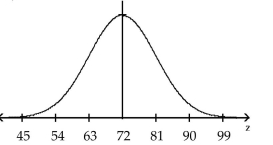
D) 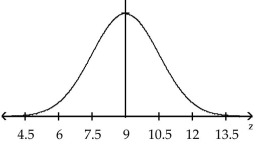
Correct Answer:
Verified
Q120: The body temperatures of adults are normally
Q121: Decide if it is appropriate to use
Q122: According to government data, the probability than
Q123: A recent survey found that 72% of
Q124: Decide if it is appropriate to use
Q126: The weights of people in a certain
Q127: Ten percent of the population is
Q128: Ten percent of the population is
Q129: A soda machine dispenses normally distributed amounts
Q130: What happens to the mean and standard
Unlock this Answer For Free Now!
View this answer and more for free by performing one of the following actions

Scan the QR code to install the App and get 2 free unlocks

Unlock quizzes for free by uploading documents