Examine the graph below. 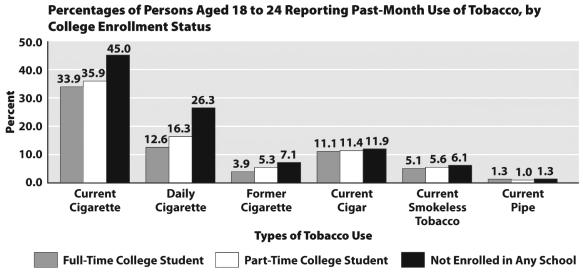
This graph shows that
A) people over the age of 45 are more likely to smoke cigarettes than those between 18 and 24 years of age.
B) nonstudents are more likely to use most forms of tobacco than college students.
C) students enrolled in college part time are unlikely to smoke cigars.
D) college students who use tobacco are more likely to get cancer.
Correct Answer:
Verified
Q23: The p53 protein is critical to the
Q34: Adducts are most likely to lead to
Q35: A protein is identified that starts a
Q37: In order for a virus to reproduce,
Q40: Why was a version of Rous's virus
Q41: Rous's work on sarcomas in chickens led
Q45: A mutated version of a virus that
Q76: A physical,chemical,or biological agent that causes cancer
Q80: _ starts with a single cell that
Q89: In order to be healthy, an organism
Unlock this Answer For Free Now!
View this answer and more for free by performing one of the following actions

Scan the QR code to install the App and get 2 free unlocks

Unlock quizzes for free by uploading documents