Examine the graph below.
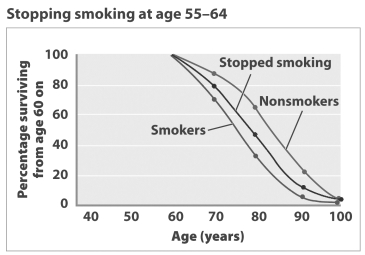
According to this graph, a person who quits smoking between the ages of 55 and 64 has a ____________ life expectancy than a person who has never smoked.
Correct Answer:
Verified
Q32: Where would you expect the effects of
Q33: Since nicotine is not normally found in
Q34: Smokers who try to quit often become
Q35: Tobacco smoke inhaled by nonsmoking people near
Q36: Smoking paralyzes the cilia lining the respiratory
Q38: When fluid collects in alveoli as a
Q39: In order for nicotine to affect a
Q40: Tobacco kills most of its victims by
Q41: Carbon monoxide (CO) binds to hemoglobin more
Q42: A smoker endangers his or her own
Unlock this Answer For Free Now!
View this answer and more for free by performing one of the following actions

Scan the QR code to install the App and get 2 free unlocks

Unlock quizzes for free by uploading documents