Examine the graph below. 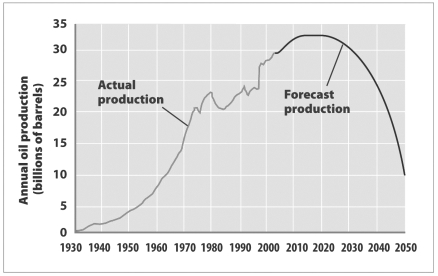
What best explains the reduction in the forecast for future world oil production shown in this graph?
A) Oil-producing nations will attempt to drive oil prices upward by severely limiting total production.
B) World demand is expected to decline as alternative energy sources like fuel cells become available.
C) The oil in known reserves will be largely consumed by 2020 with no readily available new reserves to replace it.
D) All of the above have contributed to the forecast.
Correct Answer:
Verified
Q20: Green roofs carry out photosynthesis, and hence
Q21: Wangari Maathai and the Green Belt Movement
Q22: The Index of Sustainable Economic Welfare
A) measures
Q23: Life-cycle engineering refers to documenting the environmental
Unlock this Answer For Free Now!
View this answer and more for free by performing one of the following actions

Scan the QR code to install the App and get 2 free unlocks

Unlock quizzes for free by uploading documents