Two students were asked to rate six different television shows on a scale from 0 to 10.The data are shown in the following table: 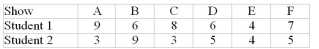 What are the television show rankings for student 1 (to be used to calculate the Spearman Rank
Correlation Coefficient) ?
A) A-1, B-4.5, C-2, D-4.5, E-6, F-3
B) A-2, B-4.5, C-2, D-4.5, E-6, F-2
C) A-1, B-4, C-4, D-5, E-6, F-1
D) A-1, B-4.5, C-2, D-4.5, E-1, F-3
Correct Answer:
Verified
Q47: A researcher is interested in investigating three
Q53: A researcher tests three different brands of
Q54: A researcher tests three different brands of
Q54: When the assumptions for the ANOVA test
Q55: Two genetics classes took the same exam
Q56: Six second grade students tried tossing a
Q59: Six second grade students tried tossing a
Q60: Six second grade students tried tossing a
Q64: A pharmaceutical company believes that a new
Q67: A man wanted to see if the
Unlock this Answer For Free Now!
View this answer and more for free by performing one of the following actions

Scan the QR code to install the App and get 2 free unlocks

Unlock quizzes for free by uploading documents