Two students were asked to rate six different television shows on a scale from 0 to 10.The data are shown in the following table: 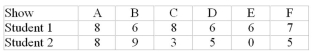
What are the television show rankings for student 2 (to be used to calculate the Spearman Rank
Correlation Coefficient) ?
A) A-2, B-1, C-5, D-3.5, E-6, F-3.5
B) A-1, B-5, C-2, D-3.5, E-6, F-3.5
C) A-2, B-1, C-6, D-3.5, E-5, F-3.5
D) A-2, B-1, C-5, D-2.5, E-6, F-2.5
Correct Answer:
Verified
Q41: Two independent sets of data are collected,
Q42: A researcher wished to compare the automobile
Q43: Use the Kruskal-Wallis test to determine if
Q44: Six second grade students tried tossing a
Q46: The data collected for studying whether or
Q47: A researcher is interested in investigating three
Q48: Six second grade students tried tossing a
Q51: A researcher tests three different brands of
Q57: A researcher is interested in investigating two
Q59: Two independent sets of data are collected,
Unlock this Answer For Free Now!
View this answer and more for free by performing one of the following actions

Scan the QR code to install the App and get 2 free unlocks

Unlock quizzes for free by uploading documents