Two students were asked to rate six different television shows on a scale from 0 to 10.The data are shown in the following table: 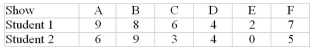
What is the Spearman Rank Correlation Coefficient for this set of data?
A) 0.413
B) 0.536
C) 0.694
D) 0.886
Correct Answer:
Verified
Q61: For a random sample of 40, if
Q62: Nonparametric tests and statistics can be used
Q69: How many runs are in the following
Q70: Two students were asked to rate six
Q71: A study of the effects of a
Q72: Test the following sequence for randomness.
Q73: Two students were asked to rate six
Q79: A study of the effects of a
Q82: The computations for the rank correlation coefficient
Q83: The _ is used to test the
Unlock this Answer For Free Now!
View this answer and more for free by performing one of the following actions

Scan the QR code to install the App and get 2 free unlocks

Unlock quizzes for free by uploading documents