Six different brands of popcorn were tested for popping.Two hundred kernels of each brand were
popped, and the number of kernels that did not pop was counted.Determine the expected value and then
plot it on a graph with the observed values. 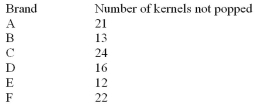
Correct Answer:
Verified
View Answer
Unlock this answer now
Get Access to more Verified Answers free of charge
Q41: If the null hypothesis is not rejected,
Q54: When data are arranged in table form
Q59: A product testing laboratory selected a sample
Q60: The following table lists the sugar content
Q61: A researcher wishes to determine if there
Unlock this Answer For Free Now!
View this answer and more for free by performing one of the following actions

Scan the QR code to install the App and get 2 free unlocks

Unlock quizzes for free by uploading documents