Draw a scatter plot for the following data that show the demand for a product (in hundreds) and its price
(in dollars) charged in nine different cities. 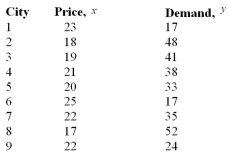
Correct Answer:
Verified
Q5: If there is a strong negative linear
Q15: is a statistical method used to determine
Q42: For a prediction value of y' from
Q69: An analysis results in a multiple regression
Q70: A study on the oxygen consumption rate
Q70: In a multiple regression model 
Q72: A study was conducted to determine if
Q73: A multiple regression line was calculated in
Q74: A correlation coefficient r was calculated to
Q78: A study on the oxygen consumption rate
Unlock this Answer For Free Now!
View this answer and more for free by performing one of the following actions

Scan the QR code to install the App and get 2 free unlocks

Unlock quizzes for free by uploading documents