Multiple Choice
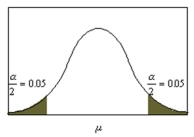 Identify the confidence interval used in the figure below.
A) 90%
B) 95%
C) 98%
D) 99%
Correct Answer:
Verified
Related Questions
Q5: When computing a confidence interval for a
Q21: A recent study of 750 Internet users
Q23: Q23: If a population has standard deviation 18, Q24: A food snack manufacturer samples 9 bags Q26: A lawyer researched the average number of Q27: In 2000 there were almost 300,000 Canadians Q27: A study of peach trees showed that Q35: A study of 100 apple trees showed Q38: A study of 60 white mice showed![]()
Unlock this Answer For Free Now!
View this answer and more for free by performing one of the following actions

Scan the QR code to install the App and get 2 free unlocks

Unlock quizzes for free by uploading documents