The following graph illustrates the typical phases of an enzyme-catalyzed reaction. 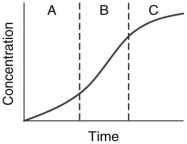
In which phase or phases has the substrate supply diminished so much that product formation slows down?
A) Phase A
B) Phase B
C) Phase C
D) Phases A and C
Correct Answer:
Verified
Q1: The following equation describes Henry's Law: S
Q2: A solution of pure water is placed
Q3: What is the significance of the following
Q4: Which of the following statements about osmolality
Q5: Serum vitamin B₁₂ is highly unstable when
Q7: Why does the initial rate of an
Q8: Which of the following explains the difference
Q9: The computerization of modern laboratories has made
Q10: Which of the following is NOT a
Q11: What impact would an increase in the
Unlock this Answer For Free Now!
View this answer and more for free by performing one of the following actions

Scan the QR code to install the App and get 2 free unlocks

Unlock quizzes for free by uploading documents