The following plot is a Levey-Jennings chart. 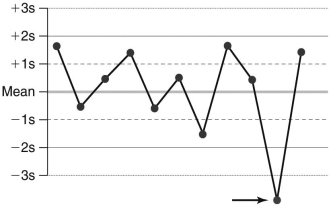
Which of the following is true about the data point noted by the arrow?
A) It indicates a shift has occurred.
B) It is an outlier.
C) It suggests the data are trending downward.
D) None of the above
Correct Answer:
Verified
Q8: The following is a Levey-Jennings chart measuring
Q9: Which of the following explains how
Q10: Which of the following is true regarding
Q11: One of three quality-control results for an
Q12: Which of the following is a crucial
Q13: Which of the following is true about
Q14: What are the rules,as stated by CLIA,for
Q15: Many laboratories have the policy that,in the
Q17: Which of the following explains the primary
Q18: On a Levey-Jennings chart,the final single
Unlock this Answer For Free Now!
View this answer and more for free by performing one of the following actions

Scan the QR code to install the App and get 2 free unlocks

Unlock quizzes for free by uploading documents