The following is a Levey-Jennings chart. 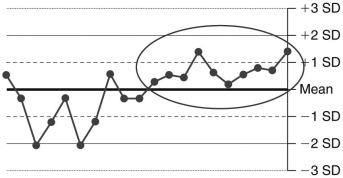
Which of the following is the best conclusion based on the circled data?
A) The data fall within 2 SD of the mean; so the recent run can be accepted.
B) The data have several outliers; so the recent run must be rejected.
C) The data comply with at least 3 of the Westgard Rules; so the recent run may be accepted.
D) The data violate the Westgard Rule of 10ₓ; so the recent run must be rejected.
Correct Answer:
Verified
Q1: Which of the following is true regarding
Q2: An automated cell counter consistently produces red
Q3: Using only the 13s rule to evaluate
Q5: A Levey-Jennings chart is created to analyze
Q6: What is a concern about the single
Q7: How can the effects of random error
Q8: The following is a Levey-Jennings chart measuring
Q9: Which of the following explains how
Q10: Which of the following is true regarding
Q11: One of three quality-control results for an
Unlock this Answer For Free Now!
View this answer and more for free by performing one of the following actions

Scan the QR code to install the App and get 2 free unlocks

Unlock quizzes for free by uploading documents