The bar graph shows the percent of income spent on leisure activities in various countries of the world. Use the graph to answer the question.
-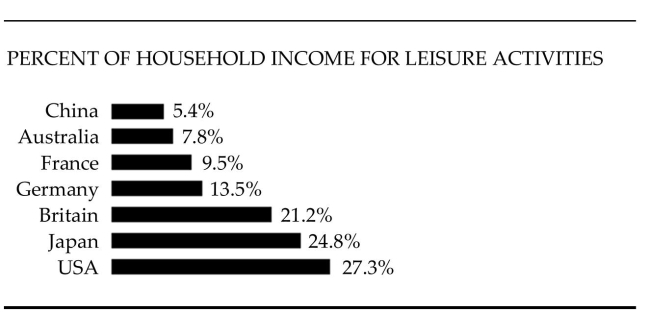 List all countries in the graph in which less than 12% of household income is spent, on average, for leisure activities.
A) Germany, Britain, Japan, USA
B) China, Australia
C) China, Australia, France
D) China, Australia, France, Germany
Correct Answer:
Verified
Q1: Use the data to complete the table.
-The
Q3: Provide an appropriate response.
-List the advantages and
Q4: Find the weighted mean. Round to the
Q5: The bar graph shows the percent of
Q6: Describe the distributions with a pie chart.
-The
Q7: This frequency table gives the distribution of
Q8: Answer the following. Round all numbers to
Q9: Find the mode or modes.
-20, 28, 46,
Q10: Provide an appropriate response.
-Explain the purpose of
Q11: Use the data to complete the table.
-On
Unlock this Answer For Free Now!
View this answer and more for free by performing one of the following actions

Scan the QR code to install the App and get 2 free unlocks

Unlock quizzes for free by uploading documents