Make a bar graph using the given frequencies.
-The frequency distribution indicates the test averages of a group of 336 students. 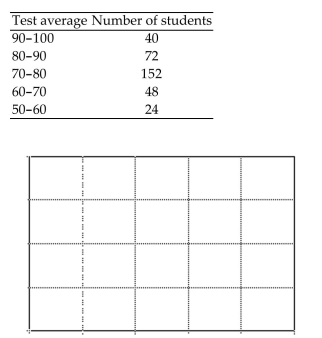
A) 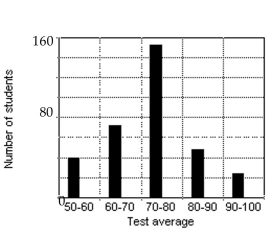
B) 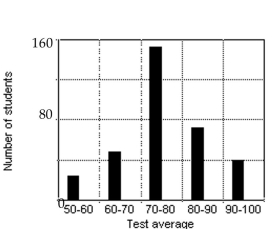
C) 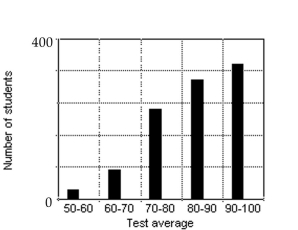
D) 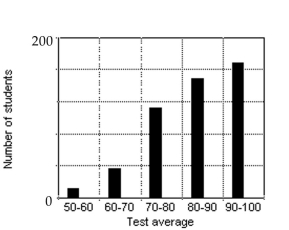
Correct Answer:
Verified
Q49: Find the mean. Round to the nearest
Q50: This frequency table gives the distribution of
Q51: This frequency table gives the distribution of
Q52: Solve the problem.
-Customer relations specialists need to
Q53: Make a line graph using the given
Q55: Use the data to complete the table.
-The
Q56: The bar graph shows the percent of
Q57: Find the median.
-Number of miles driven: 21,
Q58: The bar graph shows the percent of
Q59: Describe the distributions with a pie chart.
-The
Unlock this Answer For Free Now!
View this answer and more for free by performing one of the following actions

Scan the QR code to install the App and get 2 free unlocks

Unlock quizzes for free by uploading documents