Describe the distributions with a pie chart.
-After reviewing a movie, 300 people rated the movie as excellent, good, or fair. The following data give the rating distribution. 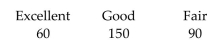
A) 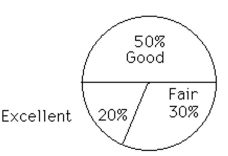
B) 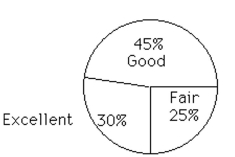
Correct Answer:
Verified
Q56: The bar graph shows the percent of
Q57: Find the median.
-Number of miles driven: 21,
Q58: The bar graph shows the percent of
Q59: Describe the distributions with a pie chart.
-The
Q60: Find the median.
-Number of customers: 277, 399,
Q62: Find the mean. Round to the nearest
Q63: Find the mean. Round to the nearest
Q64: Make a line graph using the given
Q65: Use this graph to answer the question.
Q66: Use the data to complete the table.
-The
Unlock this Answer For Free Now!
View this answer and more for free by performing one of the following actions

Scan the QR code to install the App and get 2 free unlocks

Unlock quizzes for free by uploading documents