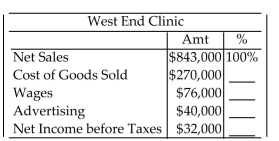
The following chart shows some figures from an income statement. Prepare a vertical analysis by expressing each item as a percent of net sales. Round percents to the nearest tenth of a percent.
-
A) 32.0%, 9.0%, 52.6%, 3.8%
B) 32.0%, 9.1%, 14.8%, 11.9%
C) 32.0%, 28.1%, 14.8%, 11.9%
D) 32.0%, 9.0%, 4.7%, 3.8%
Correct Answer:
Verified
Q6: Complete the comparative income statement. Round percents
Q7: Provide an appropriate response.
-Explain how to determine
Q8: Complete the balance sheet using vertical analysis.
Q9: Find (a) the gross profit, (b) the
Q10: Provide an appropriate response.
-Explain the purpose of
Q12: Provide an appropriate response.
-Explain the purpose of
Q13: Complete the income statement.
-Central Data Inc. had
Q14: The table compares the national averages for
Q15: Complete the income statement.
-Cindy's Sweet Shop had
Q16: The table compares the national averages for
Unlock this Answer For Free Now!
View this answer and more for free by performing one of the following actions

Scan the QR code to install the App and get 2 free unlocks

Unlock quizzes for free by uploading documents