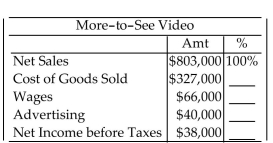
The following chart shows some figures from an income statement. Prepare a vertical analysis by expressing each item as a percent of net sales. Round percents to the nearest tenth of a percent.
-
A) 40.7%, 8.2%, 5.0%, 4.7%
B) 40.7%, 8.3%, 12.2%, 11.6%
C) 40.7%, 8.2%, 60.6%, 4.7%
D) 40.7%, 20.2%, 12.2%, 11.6%
Correct Answer:
Verified
Q25: Complete the horizontal analysis for the comparative
Q26: Find (a) the gross profit, (b) the
Q27: Complete the income statement.
-Frank's Nursery had gross
Q28: Find the current ratio and the acid-test
Q29: Complete the income statement.
-Bay Side Videos had
Q31: Complete the horizontal analysis for the comparative
Q32: Find the current ratio and the acid-test
Q33: Find the current ratio and the acid-test
Q34: Calculate the current ratio and the acid-test
Q35: Find the current ratio and the acid-test
Unlock this Answer For Free Now!
View this answer and more for free by performing one of the following actions

Scan the QR code to install the App and get 2 free unlocks

Unlock quizzes for free by uploading documents