Multiple Choice
The percentage of an adult population that smokes can be modeled by the function P(x) whose graph
Is shown below. The input x is years after 1955. Estimate the percentage of adults that smoked in 1955. 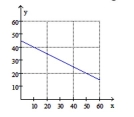
A) 15%
B) 30%
C) 40%
D) 45%
Correct Answer:
Verified
Related Questions
Q75: Evaluate the function Q76: Evaluate the function Q77: State whether or not the relation is Q78: Write Q79: Graph the linear function Q81: Graph Q82: Graph the parabola Q83: The population growth of a certain geographic Q84: Graph the parabola Q85: Graph the parabola Unlock this Answer For Free Now! View this answer and more for free by performing one of the following actions Scan the QR code to install the App and get 2 free unlocks Unlock quizzes for free by uploading documents![]()
![]()
![]()
![]()
![]()
![]()
![]()
![]()

