Multiple Choice
The percentage of an adult population that smokes can be modeled by the function P(x) whose graph
Is shown below. The input x is years after 1955. In what year did the percentage of smokers drop below
20%? 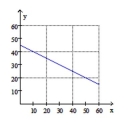
A) 2015
B) 1995
C) 1985
D) 2005
Correct Answer:
Verified
Related Questions
Q67: State whether or not the relation is
Q68: Find the domain and range of the
Q69: State whether or not the relation is
Q70: A waitress made $6.53 per hour plus

