The percentage of an adult population that smokes can be modeled by the function P(x) whose graph
Is shown below. The input x is years after 1955. Estimate the change in the percentage of smokers from
1975 to 1985. 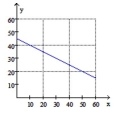
A) -10%
B) 5%
C) 10%
D) -5%
Correct Answer:
Verified
Q60: The homecoming committee is blowing up balloons
Q61: State whether or not the relation is
Q62: Graph the linear function. Q63: State whether or not the relation is Q64: Find the domain and range of the Q66: Find the domain and range of the Q67: State whether or not the relation is Q68: Find the domain and range of the Q69: State whether or not the relation is Q70: A waitress made $6.53 per hour plus![]()
Unlock this Answer For Free Now!
View this answer and more for free by performing one of the following actions

Scan the QR code to install the App and get 2 free unlocks

Unlock quizzes for free by uploading documents