Multiple Choice
The percentage of an adult population that smokes can be modeled by the function P(x) whose graph
Is shown below. The input x is years after 1955. In what years was the percentage of nonsmokers less than
60? 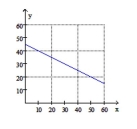
A) 0 - 60
B) 1955 - 2015
C) 1955-1970
D) 1955 - 1965
Correct Answer:
Verified
Related Questions
Q87: Graph the parabola Q88: Using the formula Q89: Graph the parabola Q90: Graph the parabola Q91: Graph Q92: Graph Q93: The height in feet of an object Q94: Graph Q95: Graph the parabola Q97: The amount of revenue a company makes Unlock this Answer For Free Now! View this answer and more for free by performing one of the following actions Scan the QR code to install the App and get 2 free unlocks Unlock quizzes for free by uploading documents![]()
![]()
![]()
![]()

![]()
![]()

