The exam grades of 31 students were used to obtain the frequency distribution below. Construct a
frequency polygon for the data. 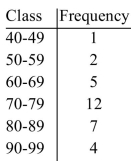
Correct Answer:
Verified
Q34: The GPAs of 20 students are given
Q35: The following frequency distribution shows for a
Q36: Construct a bar graph for the following
Q37: Construct a pie chart for the number
Q38: The grades on a college math exam
Q40: The frequency distribution below was obtained by
Q41: Find the median. Q42: Find the midrange. Q43: These data represent the number of stray Q44: Provided below are the sizes of 15![]()
![]()
Unlock this Answer For Free Now!
View this answer and more for free by performing one of the following actions

Scan the QR code to install the App and get 2 free unlocks

Unlock quizzes for free by uploading documents