The frequency distribution below was obtained by monitoring the number of vacation days per year
taken by twenty-five employees. Construct a frequency polygon for the data. 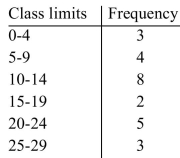
Correct Answer:
Verified
Q41: Find the median. Q42: Find the midrange. Q43: These data represent the number of stray Q44: Provided below are the sizes of 15 Q45: These data represent the number of trees Q47: Find the mean. Q48: These data represent the number of gas Q49: Fifty ten-year-olds were monitored to determine the Q50: The exam grades of 31 students were Q51: Find the median. Unlock this Answer For Free Now! View this answer and more for free by performing one of the following actions Scan the QR code to install the App and get 2 free unlocks Unlock quizzes for free by uploading documents![]()
![]()
![]()
![]()

