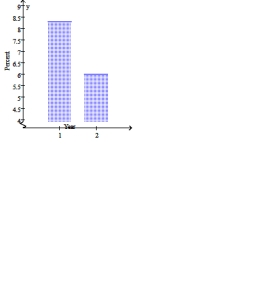
Draw a bar graph illustrating the change in a state's tax rate on each of the axes below. Note that
you'll be using the same information on each graph. 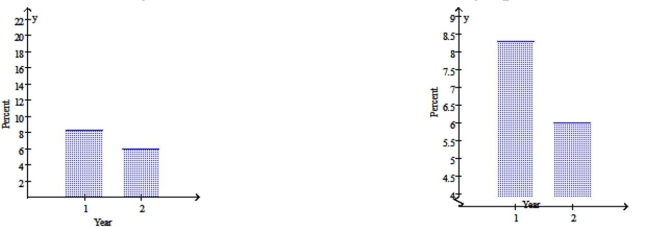
 \
\
Which of the two bar graphs would be used by someone wanting to argue that this tax cut won't hurt the state's
budget much? Why?
Correct Answer:
Verified
View Answer
Unlock this answer now
Get Access to more Verified Answers free of charge
Q157: Find the value for the correlation coefficient
Q158: Find the equation of the regression line.
Q159: A data set of size 21 has
Q160: Use the equation of the regression line
Q161: For the following data
(a)Draw a scatter plot.
(b)Find
Q163: The graphs below display the average life
Q164: Consider the survey question "Are you going
Q165: Consider the survey question "Do you think
Q166: An upcoming school levy in my town
Q167: For the following data
(a)Draw a scatter plot.
(b)Find
Unlock this Answer For Free Now!
View this answer and more for free by performing one of the following actions

Scan the QR code to install the App and get 2 free unlocks

Unlock quizzes for free by uploading documents