The diagram below shows a light curve from a supernova. How many days after maximum light did it take for the supernova to decrease in brightness by a factor of 100? 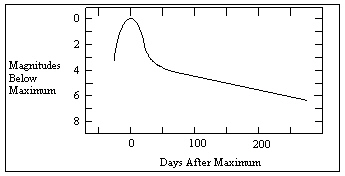
A) less than 50
B) 50
C) 150
D) 250
E) more than 250
Correct Answer:
Verified
Q20: What is the approximate age of the
Q21: A planetary nebula
A) produces an absorption spectrum.
B)
Q22: The lowest-mass stars cannot become giants because
A)
Q23: Synchrotron radiation is produced
A) in planetary nebulae.
B)
Q24: About how long will a 0.5 star
Q26: When material expanding away from a star
Q28: A planetary nebula is
A) the expelled outer
Q28: A type-II supernova
A) occurs when a white
Q29: A planetary nebula has a radius of
Q36: The Algol paradox is explained by considering
A)the
Unlock this Answer For Free Now!
View this answer and more for free by performing one of the following actions

Scan the QR code to install the App and get 2 free unlocks

Unlock quizzes for free by uploading documents