Use the data in the following table to identify which of the following statements are true.(Select all that are true) . 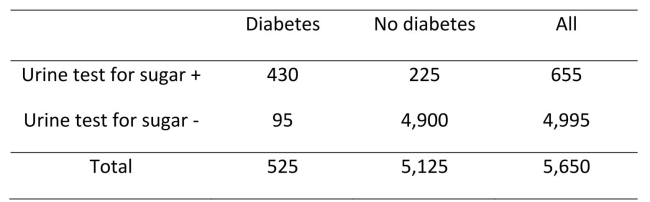
A) Prevalence = 10.2%
B) Sensitivity = 81.9%
C) Specificity = 4.4%
D) Specificity = 98.1%
E) Positive predictive value (PPV) = 65.6%
F) Negativepredictivevalue(NPV) =98.1%
Correct Answer:
Verified
Q1: Potential harms from being screened include (select
Q2: Which of the following conditions need to
Q3: Which of the following types of study
Q4: Which of the following activities should be
Q5: Which of the following statements about screening
Q6: Which of the factors listed below are
Q7: Which of the following characteristics of a
Q9: About 20% of men who come to
Q10: Use the graph below to identify which
Unlock this Answer For Free Now!
View this answer and more for free by performing one of the following actions

Scan the QR code to install the App and get 2 free unlocks

Unlock quizzes for free by uploading documents