SCENARIO 2-1
An insurance company evaluates many numerical variables about a person before deciding on an appropriate rate for automobile insurance.A representative from a local insurance agency selected a random sample of insured drivers and recorded,X,the number of claims each made in the last 3 years,with the following results.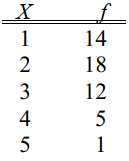
-A type of vertical bar chart in which the categories are plotted in the descending rank order of the magnitude of their frequencies is called a
A) contingency table.
B) Pareto chart.
C) stem-and-leaf display.
D) pie chart.
Correct Answer:
Verified
Q3: SCENARIO 2-5
The following are the duration in
Q4: SCENARIO 2-2
2-2 Organizing and Visualizing Variables
At a
Q5: SCENARIO 2-1
An insurance company evaluates many numerical
Q6: SCENARIO 2-4
A survey was conducted to determine
Q7: SCENARIO 2-5
The following are the duration in
Q9: SCENARIO 2-3
Every spring semester,the School of Business
Q10: A professor of economics at a small
Q11: When constructing charts,the following is plotted at
Q12: SCENARIO 2-1
An insurance company evaluates many numerical
Q13: SCENARIO 2-2
2-2 Organizing and Visualizing Variables
At a
Unlock this Answer For Free Now!
View this answer and more for free by performing one of the following actions

Scan the QR code to install the App and get 2 free unlocks

Unlock quizzes for free by uploading documents