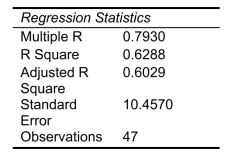
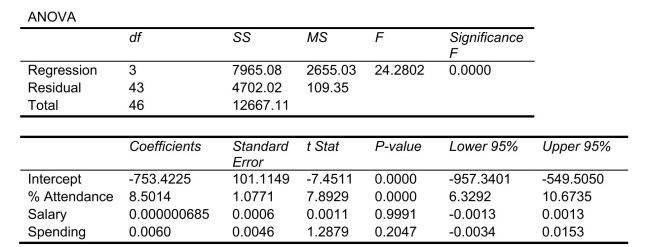
SCENARIO 18-8 The superintendent of a school district wanted to predict the percentage of students passing a sixth-grade proficiency test.She obtained the data on percentage of students passing the proficiency test (% Passing) , daily mean of the percentage of students attending class (% Attendance) , mean teacher salary in dollars (Salaries) , and instructional spending per pupil in dollars (Spending) of 47 schools in the state. Following is the multiple regression output with  as the dependent variable,
-Referring to Scenario 18-8, which of the following is a correct statement?
A) 62.88% of the total variation in the percentage of students passing the proficiency test can be explained by daily mean of the percentage of students attending class, mean
Teacher salary, and instructional spending per pupil.
B) 62.88% of the total variation in the percentage of students passing the proficiency test can be explained by daily mean of the percentage of students attending class, mean
Teacher salary, and instructional spending per pupil after adjusting for the number of
Predictors and sample size.
C) 62.88% of the total variation in the percentage of students passing the proficiency test can be explained by daily mean of the percentage of students attending class holding
Constant the effect of mean teacher salary, and instructional spending per pupil.
D) 62.88% of the total variation in the percentage of students passing the proficiency test can be explained by daily mean of the percentage of students attending class after
Adjusting for the effect of mean teacher salary, and instructional spending per pupil.
Correct Answer:
Verified
Q148: SCENARIO 18-8
The superintendent of a school district
Q153: SCENARIO 18-8
The superintendent of a school district
Q155: SCENARIO 18-8 The superintendent of a school
Q158: SCENARIO 18-7 As a project for his
Q159: SCENARIO 18-7 As a project for his
Q161: SCENARIO 18-8 The superintendent of a school
Q163: SCENARIO 18-8 The superintendent of a school
Q164: SCENARIO 18-8 The superintendent of a school
Q165: SCENARIO 18-8 The superintendent of a school
Q178: SCENARIO 18-8
The superintendent of a school district
Unlock this Answer For Free Now!
View this answer and more for free by performing one of the following actions

Scan the QR code to install the App and get 2 free unlocks

Unlock quizzes for free by uploading documents