Look at the utility function graphed below and select the type of decision-maker that corresponds to the graph.
A) Risk averter
B) Risk neutral
C) Risk taker
D) Risk player 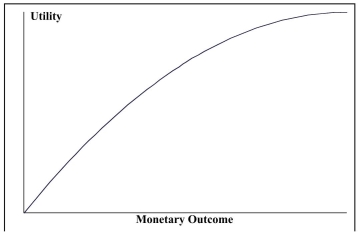
Correct Answer:
Verified
Q63: The risk seeker's curve represents the utility
Q66: SCENARIO 20-4
A stock portfolio has the following
Q68: SCENARIO 20-3
The following information is from 2
Q70: True or False: Opportunity loss is the
Q71: In a local cellular phone area,company A
Q73: SCENARIO 20-4
A stock portfolio has the following
Q76: _ is a procedure for revising probabilities
Q78: SCENARIO 20-4
A stock portfolio has the following
Q78: True or False: Removal of uncertainty from
Q80: In a local cellular phone area,company A
Unlock this Answer For Free Now!
View this answer and more for free by performing one of the following actions

Scan the QR code to install the App and get 2 free unlocks

Unlock quizzes for free by uploading documents