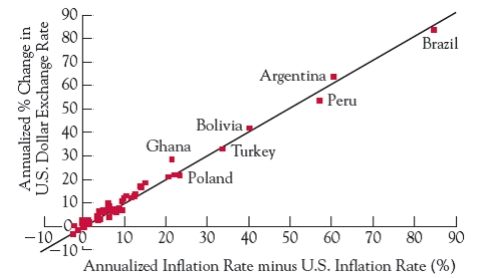
Figure 10.4, shown below, presented data on 62 countries' inflation rates relative to the U.S. rate of inflation and the percent change in the exchange rate for the years 1980-2010. What was the relationship between these two variables?
Correct Answer:
Verified
View Answer
Unlock this answer now
Get Access to more Verified Answers free of charge
Q92: There was a lot of pressure on
Q93: The price of a Big Mac in
Q94: In theory, the law of one price
Q95: The strong appreciation of the dollar for
Q96: In looking at the foreign exchange rates
Q98: Please state whether you agree or disagree
Q99: Explain why the law of one price
Q100: If the Federal Reserve in the United
Q101: Using a model of supply and demand
Q102: Explain why the changes we observe in
Unlock this Answer For Free Now!
View this answer and more for free by performing one of the following actions

Scan the QR code to install the App and get 2 free unlocks

Unlock quizzes for free by uploading documents