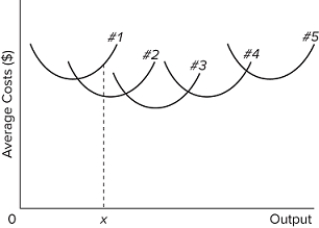
 The diagram shows the short-run average total cost curves for five different plant sizes of a firm. The position of these five curves in relation to one another reflects
A) economies and diseconomies of scale.
B) the effect of fixed costs on ATC as output increases.
C) the law of constant costs.
D) the law of diminishing returns.
Correct Answer:
Verified
Q353: Use the following data to answer the
Q354: A natural monopoly exists when
A)unit costs are
Q355: When a firm does more of something,
Q356: Use the following data to answer the
Q357: Which of the following is not a
Q359: When diseconomies of scale occur,
A)the long-run average
Q360: If a firm doubles its output in
Q361: If long-run average total cost decreases as
Q362: The ABC Corporation decreases all of its
Q363: When a firm doubles its inputs and
Unlock this Answer For Free Now!
View this answer and more for free by performing one of the following actions

Scan the QR code to install the App and get 2 free unlocks

Unlock quizzes for free by uploading documents