Multiple Choice
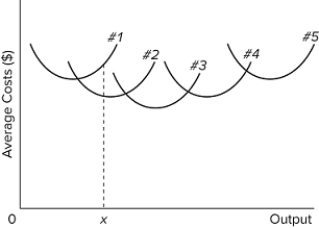 The diagram shows the short-run average total cost curves for five different plant sizes of a firm. If in the long run the firm should produce output 0 x, it should do it with a plant of size
A) #4.
B) #3.
C) #2.
D) #1.
Correct Answer:
Verified
Related Questions
Q336: Q337: Q338: If a more efficient technology was discovered Q339: Which of the following statements is true, Q340: If the price of a fixed factor Unlock this Answer For Free Now! View this answer and more for free by performing one of the following actions Scan the QR code to install the App and get 2 free unlocks Unlock quizzes for free by uploading documents![]()
![]()

