Multiple Choice
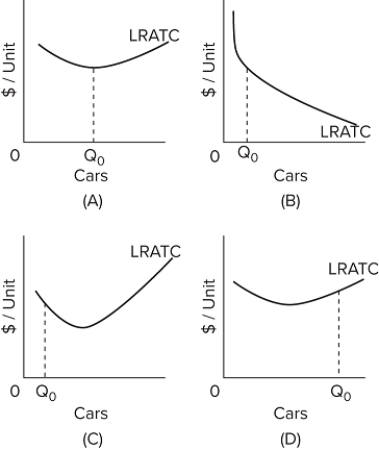 Refer to the provided graphs. They show the long-run average total cost (LRATC) for cars. For which graph are there economies of scale throughout the entire range of output of cars?
A) graph A
B) graph B
C) graph C
D) graph D
Correct Answer:
Verified
Related Questions
Q395: Plant sizes get larger as you move
Q396: Plant sizes get larger as you move
Q397: A given level of consumer demand will
Unlock this Answer For Free Now!
View this answer and more for free by performing one of the following actions

Scan the QR code to install the App and get 2 free unlocks

Unlock quizzes for free by uploading documents