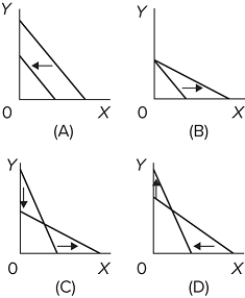
 Which of the graphs shows a change in the buyer's income, but no changes in the prices of X and Y?
A) graph A
B) graph B
C) graph C
D) graph D
Correct Answer:
Verified
Q237: The table shows the total utility data
Q238: All of the following would reduce property
Q239: The table shows the total utility data
Q240: Many people do not steal or commit
Q241: An indifference curve shows
A)the maximum combinations of
Q243: Suppose a consumer has an income of
Q244: If two combinations of goods X and
Q245: A consumer has an income of $200,
Q246: A leftward shift of a consumer's budget
Q247: If a consumer has an income of
Unlock this Answer For Free Now!
View this answer and more for free by performing one of the following actions

Scan the QR code to install the App and get 2 free unlocks

Unlock quizzes for free by uploading documents