Multiple Choice
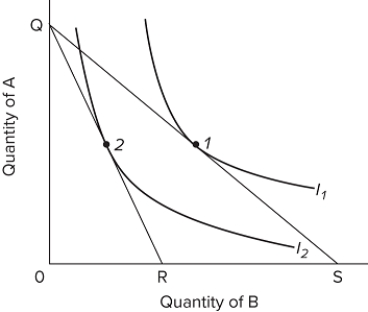 The graph shows two indifference curves, and QR and QS represent different budget lines. A change in the equilibrium position on the diagram from point 1 to point 2 could result, other things being equal, from
A) an increase in the price of B.
B) a decrease in the price of A.
C) a decrease in the consumer's money income.
D) an equal percentage increase in the consumer's money income and in the price of B.
Correct Answer:
Verified
Related Questions

