Multiple Choice
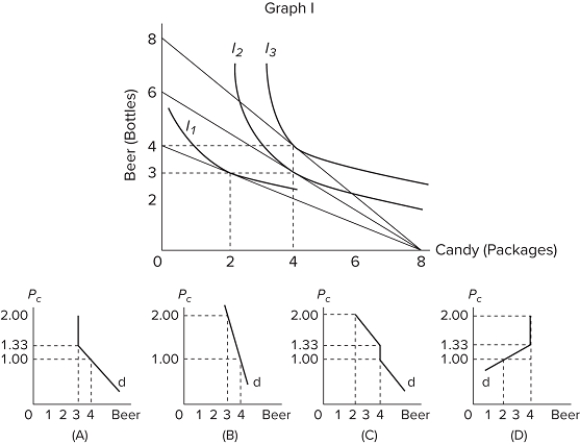 Graph I above shows E.T.'s equilibrium combinations of beer and candy for three different prices of beer. (I₁, I₂, and I₃ are indifference curves. The price of a package of candy is constant at $1.00.) Letting Pc represent the price of beer, which demand curve (d) above is consistent with graph I?
A) graph A
B) graph B
C) graph C
D) graph D
Correct Answer:
Verified
Related Questions

