 The diagram shows two product supply curves. It indicates that
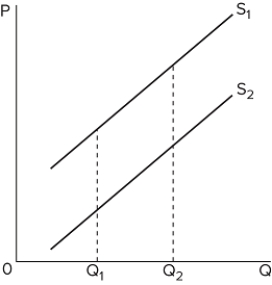
A) over range Q₁Q₂, price elasticity of supply is greater for S₁ than for S₂.
B) over range Q₁Q₂, price elasticity of supply is greater for S₂ than for S₁.
C) over range Q₁Q₂, price elasticity of supply is the same for the two curves.
D) not enough information is given to compare price elasticities.
Correct Answer:
Verified
Q261: It takes a considerable amount of time
Q262: The main determinant of elasticity of supply
Q263: The supply of product X is inelastic
Q264: Q265: Airlines charge business travelers more than leisure Q267: The supply of product X is elastic Q268: Suppose that the price of product X Unlock this Answer For Free Now! View this answer and more for free by performing one of the following actions Scan the QR code to install the App and get 2 free unlocks Unlock quizzes for free by uploading documents![]()

