Multiple Choice
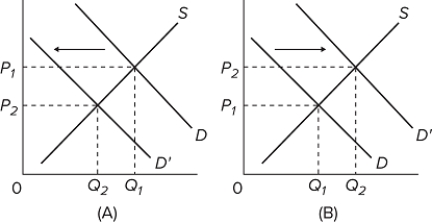
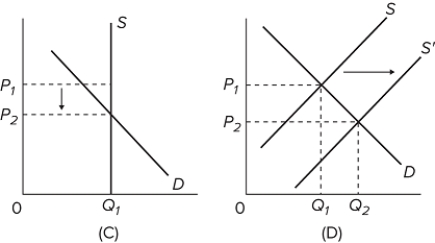 Refer to the above graphs. Which graph depicts a situation where sellers are increasing their output because their product is becoming more popular among buyers?
A) graph A
B) graph B
C) graph C
D) graph D
Correct Answer:
Verified
Related Questions
Q333: Elasticity of supply will increase when
A)the number
Q334: Cross elasticity of demand measures how sensitive
Q335: Q336: We would expect the cross elasticity of Q337: Suppose the income elasticity of demand for Q339: If the income elasticity of demand for![]()
Unlock this Answer For Free Now!
View this answer and more for free by performing one of the following actions

Scan the QR code to install the App and get 2 free unlocks

Unlock quizzes for free by uploading documents