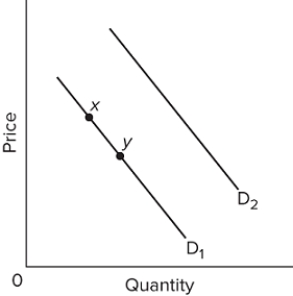
 Refer to the diagram. A decrease in quantity demanded is depicted by a
A) move from point x to point y.
B) shift from D₁ to D₂.
C) shift from D₂ to D₁.
D) move from point y to point x.
Correct Answer:
Verified
Q25: In 2018, the price of oil increased,
Q37: Blu-ray players and Blu-ray discs are
A) complementary
Q67: The location of the product supply curve
Q77: Increasing marginal cost of production explains
A) the
Q81: A firm's supply curve is upsloping because
A)the
Q82: A leftward shift of a product supply
Q82: An increase in the excise tax on
Q83: (Advanced analysis)The equation for the supply curve
Q88: Answer the question based on the given
Q89: ![]()
Unlock this Answer For Free Now!
View this answer and more for free by performing one of the following actions

Scan the QR code to install the App and get 2 free unlocks

Unlock quizzes for free by uploading documents