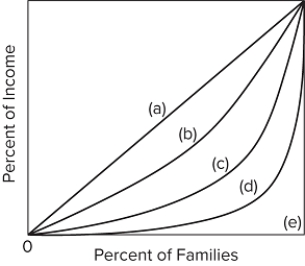
 Refer to the diagram, where curves (a) through (e) are for five different countries. Of the countries listed below, income is most unequally distributed in country
A) a.
B) b.
C) c.
D) d.
Correct Answer:
Verified
Q64: The Gini ratio of income inequality ranges
Q65: Q66: Suppose the members of population A, consisting Q67: Suppose the members of population A, consisting Q68: Which of the following Gini ratios indicates Q70: The lowest quintile of households in the Q71: The Lorenz curve portrays Q72: The Gini ratio Q73: Census data indicate that, as of 2017, Q74: The highest quintile of households in the![]()
A)the functional distribution of
A)measures the relative extent of
Unlock this Answer For Free Now!
View this answer and more for free by performing one of the following actions

Scan the QR code to install the App and get 2 free unlocks

Unlock quizzes for free by uploading documents