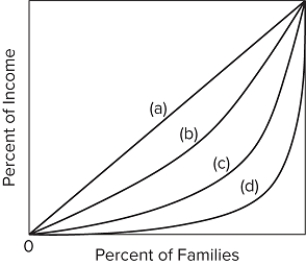
 Refer to the diagram. If line (c) represents the distribution of income in 1980 in the United States, we would expect the distribution of income for 2017 to be more like
A) line (a) .
B) line (b) .
C) line (c) .
D) line (d) .
Correct Answer:
Verified
Q83: Standard census data on the distribution of
Q84: People's incomes are relatively low when they
Q85: Which of the following would likely reduce
Q86: In the United States, the lifetime distribution
Q87: Each of the following contributes to income
Q89: Some economists have criticized standard government figures
Q90: Housing subsidies for low-income households
A)represent a cash
Unlock this Answer For Free Now!
View this answer and more for free by performing one of the following actions

Scan the QR code to install the App and get 2 free unlocks

Unlock quizzes for free by uploading documents