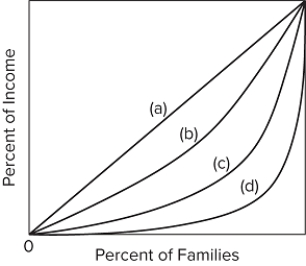
 Refer to the diagram. If line (c) represents the distribution of income before taxes and transfers and line (b) represents the distribution after taxes and transfers, then taxes and transfers have
A) added to income inequality.
B) decreased the Gini ratio.
C) increased poverty.
D) reduced real GDP per person.
Correct Answer:
Verified
Q89: Some economists have criticized standard government figures
Q90: Housing subsidies for low-income households
A)represent a cash
Q91: Q92: Which of the following is a noncash Q93: Income mobility Q95: In the United States, Q96: The movement of individuals and households from Q97: Income mobility Q98: Which of the following countries has the Q99: If discrimination based on gender and race![]()
A)contributes to greater wealth inequality in
A)taxes decrease, but transfers
A)makes lifetime income inequality among income
Unlock this Answer For Free Now!
View this answer and more for free by performing one of the following actions

Scan the QR code to install the App and get 2 free unlocks

Unlock quizzes for free by uploading documents