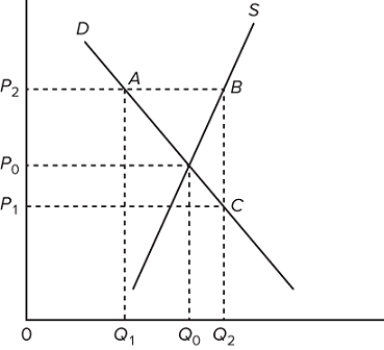
 Refer to the graph of the market for wheat. The government adopts a price support program for wheat and supports the wheat price at P ₂. The triangular area defined by points B and C and the intersection of the supply and demand curve represents the
A) parity ratio.
B) taxpayers' burden.
C) efficiency gain.
D) efficiency loss.
Correct Answer:
Verified
Q180: A significant reason that increases in demand
Q181: The price of a certain farm product
Q182: Farm price support programs have other costs
Q183: If the parity ratio goes from 0.8
Q184: Q186: Which of the following is a major Q187: Farm price support programs tend to Q188: The concept of parity in farm policy![]()
A)benefit both
Unlock this Answer For Free Now!
View this answer and more for free by performing one of the following actions

Scan the QR code to install the App and get 2 free unlocks

Unlock quizzes for free by uploading documents