Multiple Choice
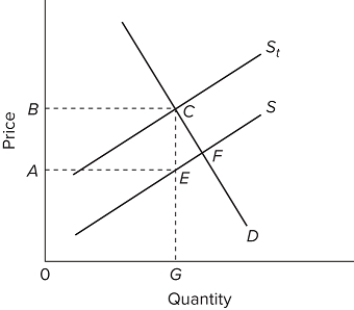 In the figure, S is the before-tax supply curve and Sₜ is the supply curve after an excise tax is imposed. The efficiency loss of this tax will be area
A) ABCE.
B) ABCE + ECF.
C) 0 AEG.
D) ECF.
Correct Answer:
Verified
Related Questions
Q168: If the demand for a product is
Q169: Assume the demand for automobile tires is
Q170: The efficiency loss of a tax is
A)
Q171: (Advanced analysis)The equations for the demand and
Q172: If the demand for a product is
Q174: (Advanced analysis)The equations for the demand and
Unlock this Answer For Free Now!
View this answer and more for free by performing one of the following actions

Scan the QR code to install the App and get 2 free unlocks

Unlock quizzes for free by uploading documents