Multiple Choice
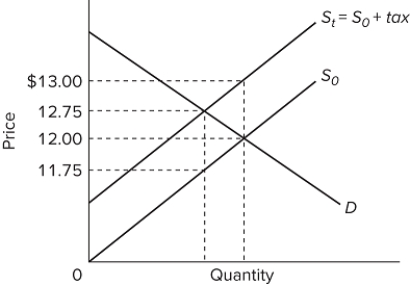 The graph shows the supply curve for a product before tax ( S ₀ ) and after an excise tax is imposed ( S ₁) . If 500 units of the product are sold after the tax is imposed, the amount of tax revenue going to the government is
A) $125.
B) $250.
C) $375.
D) $500.
Correct Answer:
Verified
Related Questions

