Multiple Choice
 The graph represents the market for a product where D ₁ and S ₁ show the initial supply and demand curves, and supply shifts to S ₂ due to a sales tax. The government's tax revenue is represented by area
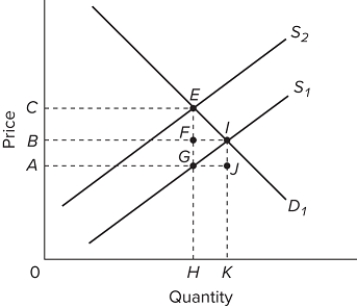
A) FIJG.
B) ACEG.
C) BCEF.
D) ABFG.
Correct Answer:
Verified
Related Questions

