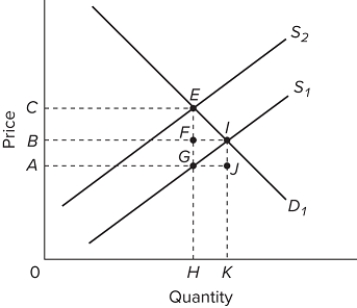
 The graph represents the market for a product where D ₁ and S ₁ show the initial supply and demand curves, and supply shifts to S ₂ due to a sales tax. The deadweight loss due to the tax is represented by area
A) EIG.
B) EFI.
C) BCEF.
D) ABFG.
Correct Answer:
Verified
Q302: The tax that is most difficult to
Q303: The federal tax system is
A)proportional, while state
Q304: In 2016, the top 5 percent of
Q305: In designing taxes, the government economists might
Q306: Which of the following statements about specific
Q308: In 2012, households in the top income
Unlock this Answer For Free Now!
View this answer and more for free by performing one of the following actions

Scan the QR code to install the App and get 2 free unlocks

Unlock quizzes for free by uploading documents